


No single study compares postcards, Google Search Ads, SEO and social with one method, so each figure here carries its own publisher, period and sample.

Key numbers for HVAC marketing ROI by channel
Compare rows only within a channel: a mail response rate and a search cost per lead are different units.
| Stat | Source, period | Sample | What it means for you |
|---|---|---|---|
| $66.69 average Google Ads cost per lead, all industries | WordStream, Apr 2025 to Mar 2026 | 13,474 US campaigns | A baseline, not an HVAC target |
| $90.92 per lead, $8.33 per click, home and home improvement | Same report | Same | Home trades pay about 36% more |
| $127.74 per lead, $9.68 per click, air conditioning install and repair | LocaliQ, Apr 2024 to Mar 2025 | 3,211 US campaigns | The closest HVAC planning number |
| $129.02 per lead, $9.30 per click, heating and furnaces | Same report | Same | Winter leads cost like summer leads |
| $30 to $90 per high-intent HVAC lead, 25% to 40% close rate | Contractor Magazine, Aug 2026 | One agency’s clients | Possible, not typical |
| 3.16% response, 37.57% open rate, mail from service providers such as HVAC | Focus Digital, Jul 2026 | Campaigns in 15 industries | Opened far more than answered |
| 97% of consumers read reviews for local businesses | BrightLocal, Feb 2026 | 1,002 US adults | Reviews shape map pack calls |
| 31% will only use a business rated 4.5 stars or higher | Same survey | Same | Your rating is part of your ROI |
What Google Search Ads benchmarks say for HVAC and home services
For 2024, the answer depends on the dataset: WordStream’s 2024 report (17,998 US campaigns, April 2023 to March 2024) put home and home improvement at $82.27 per lead, and LocaliQ’s HVAC campaigns starting April 2024 ran about 55% higher.
WordStream’s all-industry average went from $53.52 in its 2023 report to $66.69 in 2024, when cost per lead rose in 19 of 23 industries by about 25%, and to $70.11 in the 2025 report before its first drop in five years in the 2026 report. Home and home improvement kept climbing throughout.
LocaliQ’s earlier report (4,595 accounts, May 2020 to June 2021, now historical) showed $55.15 per lead for air conditioning services and $62.18 for heating. The methods differ, but HVAC search leads now cost about twice as much, so a cost-per-lead target taken from older articles makes a healthy campaign look like it’s failing.
What published data says about Local Services Ads versus Search Ads
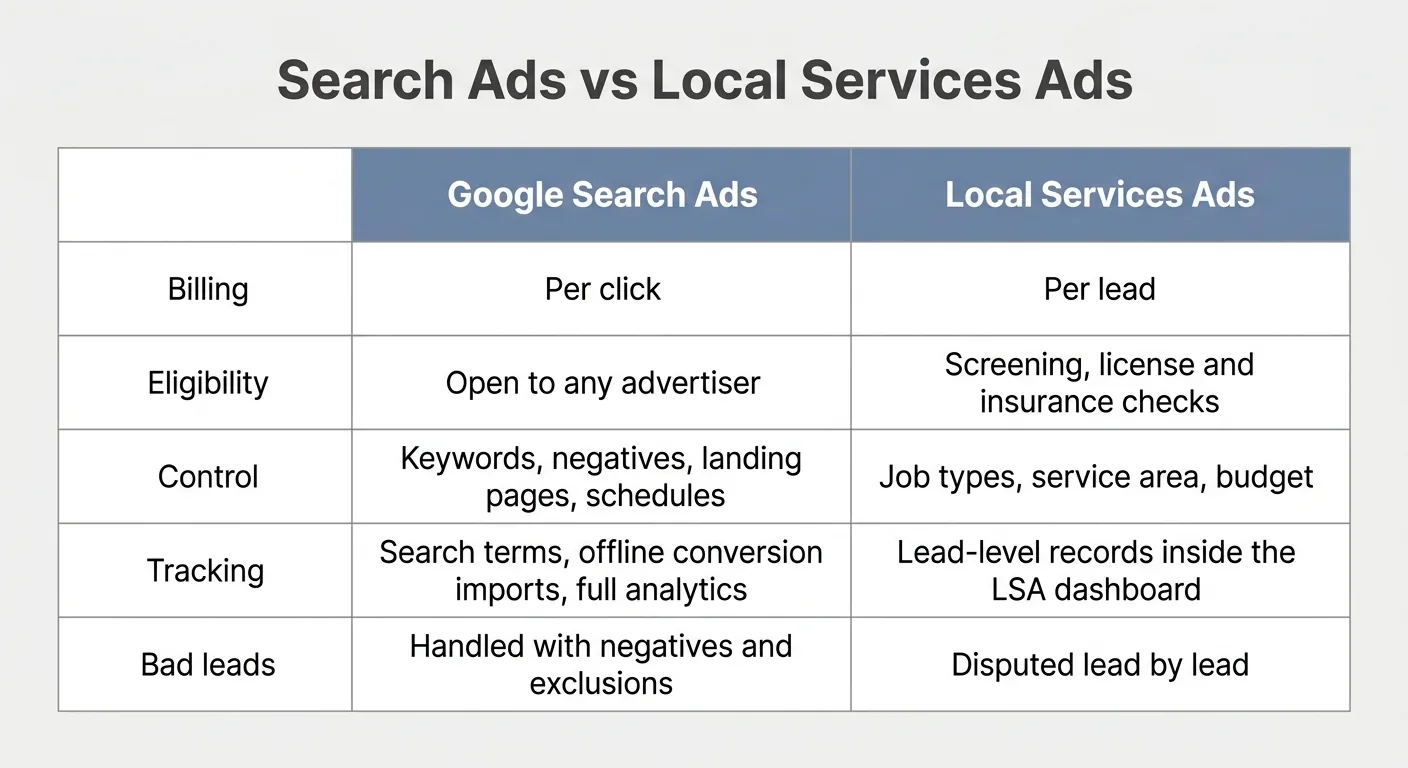
No published study shows whether Search Ads or Local Services Ads is better for HVAC, because Google sells them on different terms. With Search Ads you pay for each click; with LSAs you are charged for each valid lead, and low-quality leads get “reassessed by our models over time” and may be credited.
| Google Search Ads | Local Services Ads | |
|---|---|---|
| Eligibility | Any advertiser | Screening: license, insurance, background checks where required |
| Control | Keywords, negatives, landing pages | Job types, service area, budget |
Google is also moving LSAs into Performance Max with pay-per-lead goals from August 2026, starting with select US home service categories, and historical LSA reports won’t transfer. Sure Shot Systems does not run Local Services Ads for any client; it runs Google Search Ads with location assets, so treat this as education. The fuller trade-off is in “Why Contractors Lose Money on Google: Causes and Fixes.”
How direct mail postcards benchmark against digital channels
Format matters as much as the list: Focus Digital measured 2.79% response for postcards against 8.38% for letters in envelopes. Housecall Pro quotes 0.5% to 2% but names no study, so treat it as a floor.
Worked example, 1,000 postcards. The $700 drop cost and funnel rates are assumptions.
| Step | Focus Digital rate | Housecall Pro 1% |
|---|---|---|
| Responses | 32 | 10 |
| Real in-area requests (60%) | 19 | 6 |
| Booked (70%) | 13 | 4 |
| Sold (40%) | 5 | 2 |
| Cost per sold job | $140 | $350 |
A response rate alone can’t show whether a mailing paid. To prove it, print a unique phone number and QR code, match the mailed address file against sold jobs for 60 days, and hold back a random 10% of the list; revenue from mailed addresses minus the holdout’s is the incremental lift.
What SEO and local SEO numbers can and cannot prove
No public study ties HVAC organic rankings to sold jobs and gross profit, so no benchmark shows SEO beating Google Ads on long-run return. What the data does show is where reviews get read: in BrightLocal’s 2026 survey, Google’s share as a review source fell from 83% in 2025 to 71%.
That leaves four numbers to track separately: nonbranded organic calls, branded organic (a reputation signal), map pack actions from your Google Business Profile, and booked jobs with an organic or map source in the CRM. We report all four Google surfaces weekly as Search Share.
How social media should be measured as an assist channel
Measure social by assisted conversions unless your CRM closes the loop on revenue; no HVAC-specific social benchmark with a named sample has been published. Cold Meta traffic lacks the urgency of a “no heat” search, so prospecting is read through branded search impressions in Search Console, retargeting through assisted conversions in Google Analytics 4 on paths ending in a branded search or map pack call, and lead forms through the same cost per sold job test as search.
A simple comparison table by channel
What each channel’s benchmark reports, and how tightly it ties to a sold job:
| Channel | Benchmark measures | Attribution strength |
|---|---|---|
| Google Search Ads | Cost per call or form | Strong with offline imports |
| Local Services Ads | Charged leads | Moderate |
| SEO and local SEO | Map pack actions, nonbranded traffic | Moderate, needs CRM source |
| Direct mail | Response per piece | Weak without a holdout |
| Social media | Reach, assisted conversions | Weak on last click |
What the benchmarks imply for splitting HVAC budget by stage and season
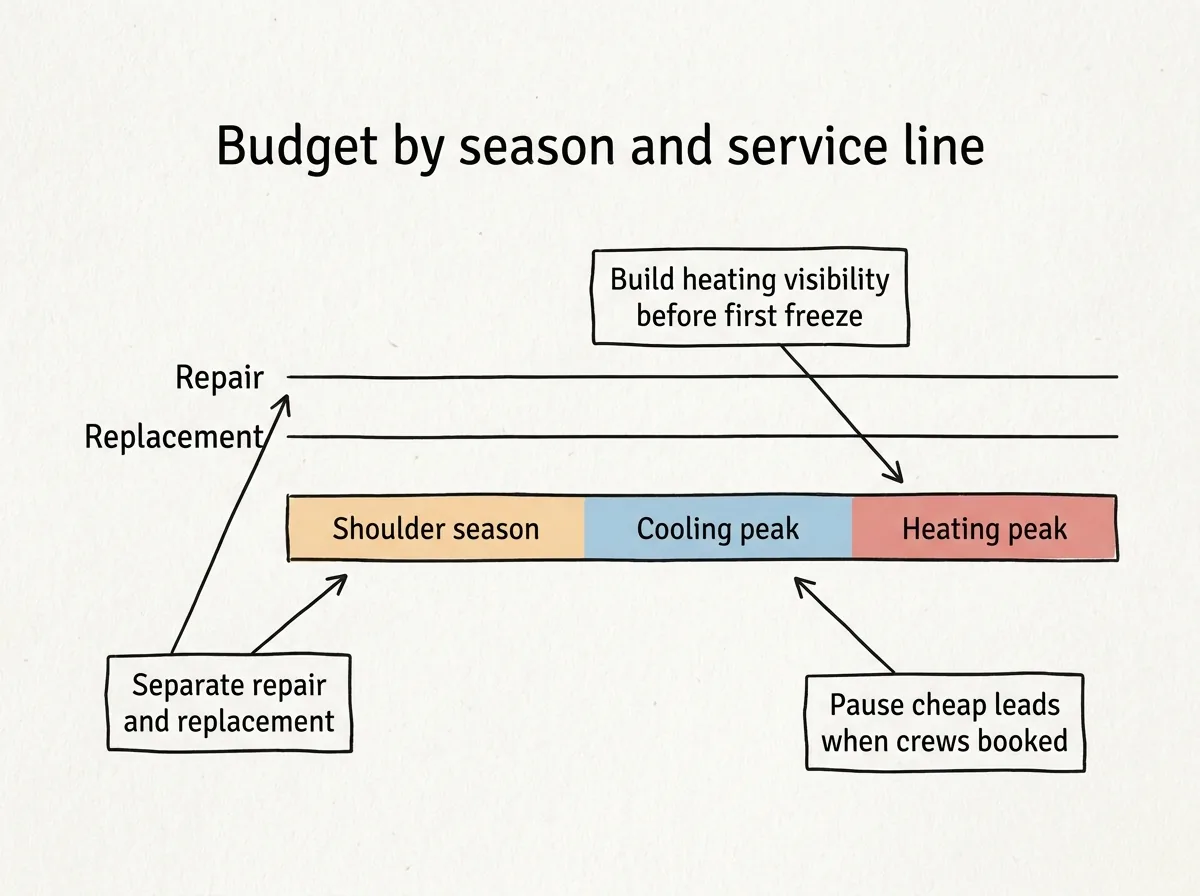
At the Contractor Magazine close rates, a lead at LocaliQ’s HVAC average works out to roughly $320 to $510 per sold job, against Contractor Magazine’s job values of about $400 for a tune-up and $12,000 for a full install. That gap is the case for separate repair and replacement ceilings. Heating leads cost more than cooling leads in both LocaliQ datasets, so heating budget belongs in place before the first freeze. In the slow season, Focus Digital’s 5.30% response for house lists against 2.90% for targeted prospect lists favors mailing past customers and selling maintenance plans. When crews are booked out, cut the channel with the highest cost per sold job first. Dollar budgets are in “HVAC Marketing Budget: What You Will Pay and Why,” and the free Demand Gap Snapshot shows which Google result types you’re missing.
What the benchmarks require to prove return across offline and online channels
ServiceTitan’s worked example shows how one rate moves the result: $500 of spend, 10 leads at $50 each and a 40% booking rate make $125 per booked job. Our own first-party funnel is outside HVAC: at Precision Patch Pros, a drywall company, March 2026 produced 26 leads, 22 proposals and 10 closed jobs worth $11,030 from Google, over 36% of that month’s sales, which is a 38% lead-to-sale rate at about $1,100 per job. Numbers like these need every call and form tagged through to the booked job in ServiceTitan, Housecall Pro, Jobber or your CRM, with sold-job values sent back to Google through offline conversion imports, which “measure what happens in the offline world after your ad results in a click or call.” Setup steps are in “Local Marketing Strategy for Contractors: 5-Phase Checklist.”
The mistakes that make HVAC channel ROI look better or worse than it is
Most gaps between an owner’s numbers and these benchmarks come from method rather than performance. Mixing repair and replacement lets one install hide a losing repair campaign. Last-click reporting hands the credit for mail, social and SEO to the branded search that follows them. Treating cost per lead as acquisition cost ignores every lead you paid for and didn’t close. Unanswered after-hours calls get logged as expensive leads, and averaging July with October blends two different businesses.
What a 90-day test needs to measure channel ROI in your own market
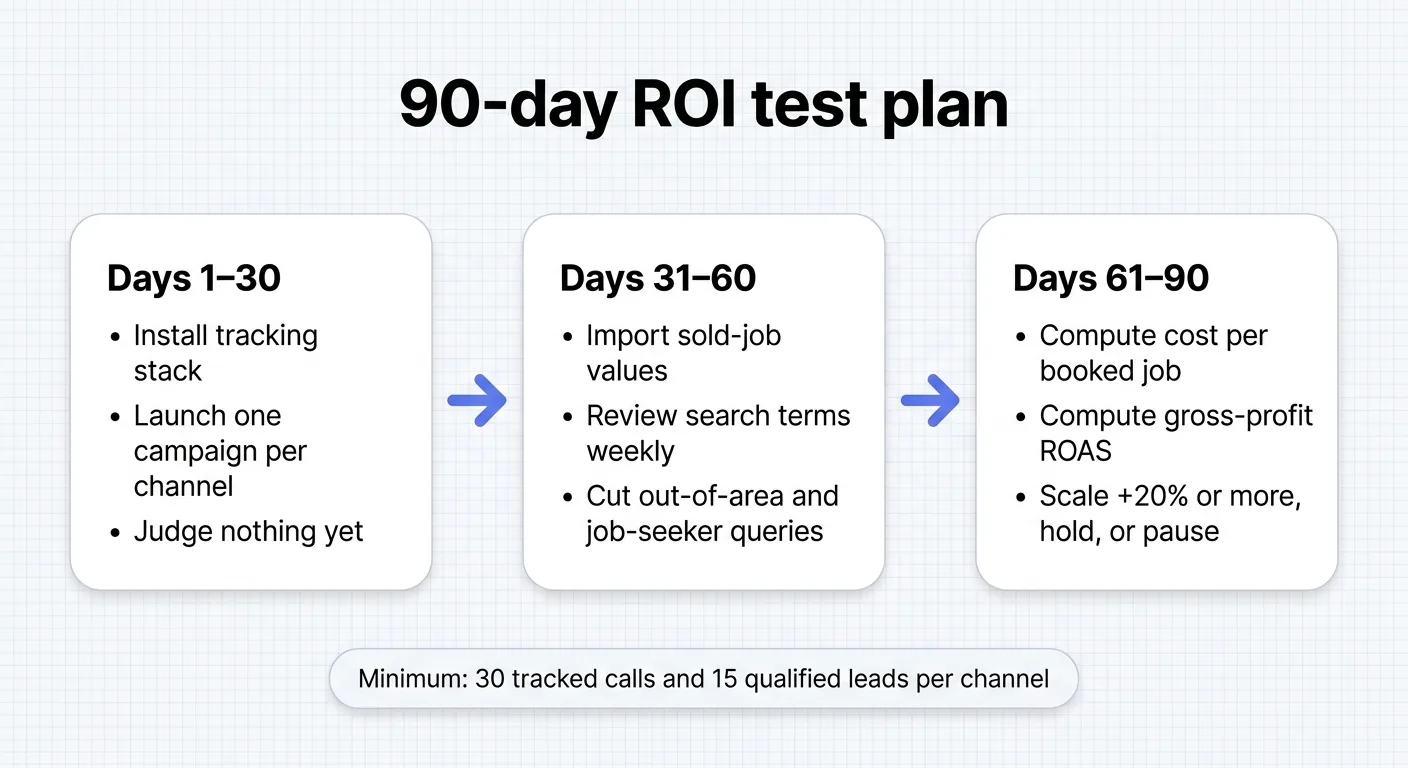
Our typical LDC Framework timing is first Google Ads calls in week one, map pack movement in 30 to 60 days and organic results in 3 to 6 months, so a 90-day test reads paid search fully, the map pack partly and organic barely. Use the first 30 days to get tracking live with one offer and one service area per channel, import sold-job values during days 31 to 60, and at day 90 compare cost per sold job by channel and service line: scale anything at least 20% under your target, hold anything in range, and pause anything above target with a clean funnel.
Sources, method, and update notes
- Headline samples and periods are in the key numbers table. Also used: WordStream 2024 and 2025 editions; LocaliQ 2020 to 2021 report, used only as history; Housecall Pro, updated October 2025, no study named; ServiceTitan, April 2024, illustrative; Profitability Partners, June 2026, 200+ P&Ls; Google Help pages, read September 2026.
- Excluded: agency lead-cost and ROAS ranges with no named study or sample, and anything older than three years except the labeled LocaliQ history. No survey figure here is a Sure Shot client result.
- Next update when WordStream and LocaliQ publish new editions, no later than June 2027.
If you want to know where your business shows up before you commit budget to any channel, start with the free Demand Gap Snapshot.
Frequently asked questions
What is a good HVAC Google Ads conversion rate?
Roughly 6.5% to 8% of clicks becoming a call or form. LocaliQ reports 6.56% for air conditioning install and repair and 7.48% for heating, and WordStream reports 8.05% for home and home improvement.
How many HVAC leads are needed before a channel ROI benchmark is reliable?
At least 30 tracked leads and 10 sold jobs per channel, and a full season for mail and SEO. Below that, one large install can swing the average.
Should HVAC marketing ROI be calculated from leads, booked calls, sold jobs, or gross profit?
Gross profit. Use ROAS (attributed revenue divided by media spend) as a quick read, then marketing ROI as gross profit minus marketing cost, divided by marketing cost.
What is a good profit margin for HVAC companies?
Most HVAC companies net between 5% and 12%, according to Profitability Partners, while ServiceTitan cites 10% to 20% net as healthy. At those margins, a channel can look fine on ROAS and still lose money.
How can HVAC companies measure SEO leads when customers call instead of filling out a form?
Use dynamic number insertion on the website, a separate tracked number on your Google Business Profile and a required source field at booking, so organic callers show up as booked jobs.
Researched and written with Sure Shot Cited, the AI article writer we built for our own client work, then reviewed by Ben Desjardins before it went live.